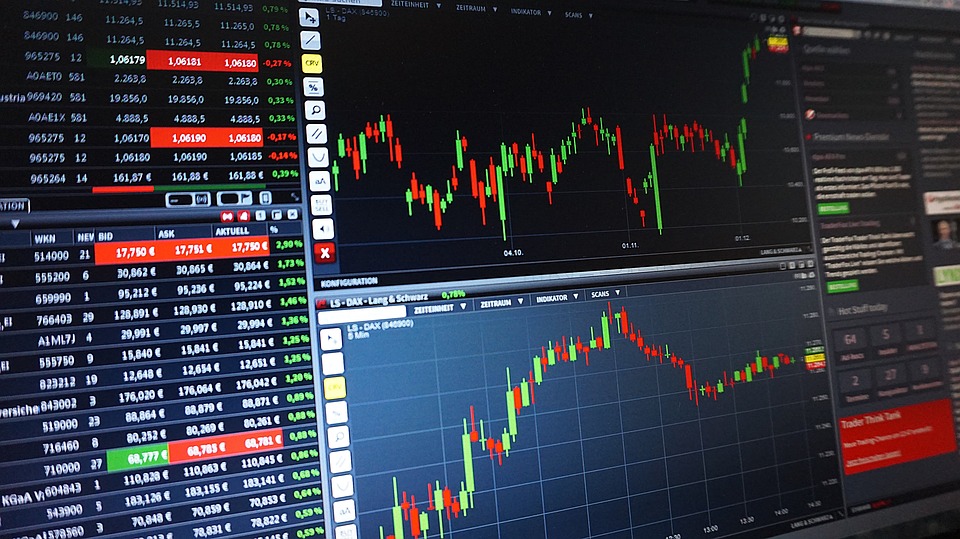
It’s difficult to become a successful trader without being able to understand forex charts. The exchange rate charts are a window into the trends and patterns that will inform the types of trades you make and the timing of your trade entries and exits.
While not always true, forex traders try to place bids when they have identified a trend and after a “pullback” event (when a market shifts in the opposite direction) has occurred as this will mean they are rallying with the momentum of the market. This type of trade is known as a breakout.
Timing is everything when trading currencies on the foreign exchange market as you will need to read a few charts to identify trends and patterns that you can act on, either by entering or exiting the market. Here are a few of the most common charts that traders utilise daily.
Tick charts
A tick chart tracks the minutiae of market movements during trading with the “tick” being the data point that is drawn when the market ticks over. This chart offers a short-term analysis due to the absence of a fixed-time axis. If you want to see new trends and any support or resistance as you attempt to time your trades, tick charts are very useful.
When using MetaTrader 4 software, which is one of the reasons why eToro gets good reviews, you can find the tick chart for a currency pair by clicking on USD/EUR, for example, in the MarketWatch window.
Point and figure charts
Point and figure charts are another simple system for pinpointing entry and exit points. These are more in-depth and are designed for long-term investment. Point and figure charts look at supply and demand and visualise price movements so traders can spot emerging trends.
Some experts believe they are also better suited to determining support and resistance levels as micro price movements are filtered out, and false breakouts are not as easily registered.
Line charts
Line charts generally use closing prices, though high, low and opening prices can also be observed depending on a trader’s requirements. A line chart connects the dots between a currency’s exchange rate over a certain time period, usually per day for a month.
This a simple tool for a quick snapshot of exchange rate movements and thus needs to be complemented with more vigorous analysis from other charts. They are useful for identifying macro trends and unlike tick charts and point and figure charts, do have fixed time intervals on the x-axis.
Bar charts
Bar charts up the ante by visualising the open, close and high and low points for a currency. A vertical line connects a currency’s high and low points, while a horizontal dash accounts for the open and closing price of a currency.
Bar charts are a primary tool for extrapolating gaps in the exchange rate. When the bars do not overlap, you can identify a pattern that may point to a potential overlap. Like line charts, there is an x-axis with fixed intervals.
Candlestick charts
Candlestick charts, similar to bar charts, were first created by Japanese traders who wanted a better representation of the movements of a currency over a particular time period. The colour of the “candle”, made up of the high, low, opening and closing points, gives a more identifiable signal to bullish or bearish moves.
A white body, for example, points to the currency trending higher, while a black body signals the opposite. Vertical lines on candlestick charts, known as “wicks” can also reveal information about upcoming market behaviour.
Timing your trades
The opening and closing of a position is a fundamental aspect of forex trading. You first need to use the aforementioned charts to identify a trend and pick your position. You want to buy low and sell high when entering and sell high and buy low if you are exiting.
Next up, try to make use of limit orders, which will trigger a purchase or sale at a specific price. The majority of brokers have this feature built-in – so it should be easy to set up. Stop losses are another important tool in your armoury. A stop-loss will close your position to limit your deficits if you are losing out.
After entering a forex trade, make sure to use technical indicators like Bollinger Bands and Moving Averages to keep track of your trades. You can exit a trade by issuing a take-profit order or via a stop-loss order.
Your entry and exit strategy should be based on the time spectrum of your trades and the risks involved. Short-term day traders, for example, may be best suited to a higher frequency of entry points with a robust safety net of exit orders. Using every available tool and data set and developing your own style and strategy over time is the best way to get better at timing your trades.